⚡ Tl;dr
- We hear from larger organizations implementing the C4 model that they have challenges managing large numbers of software systems and context diagrams.
- The C4 model’s supplementary system landscape diagram shows an overview of the software systems across your organization.
- To make diagrams easy to digest and navigate, allow people to dive into further detail in areas that interest them.
🚀 Let’s kick-off
The C4 model is an excellent tool for visualizing and communicating software architecture. If you’re unfamiliar with the C4 model, you can check out our blog post for a run-down on what it is and how to use it. Essentially, it consists of just two things:
- A simple set of abstractions to describe your architecture.
- Four core diagram types to visualize the abstractions.
As you can guess, there are four levels in the C4 model. Each is tailored to a specific audience, with increasing technical understanding the deeper you go. Even though there are only four core levels, you may have come across the term level 0 or C4+1 being used. Let’s get into what this means.
🤯 Too many context diagrams?
One of the key problems we hear from teams using the C4 model at scale is that they have too many diagrams at the top level (the context level).
The system context diagram is the most commonly used diagram type in the C4 model and is likely the most useful as it provides value to both technical and non-technical audiences. This “big picture” diagram sits at the top of the 4 C’s and is a great starting point for learning about a software system. The software system is usually drawn in focus at the center with all its dependencies connected around it.
Smaller companies with a few teams and a handful of software systems won’t have any trouble here. A few context diagrams can be a great entry point for anyone wanting to learn about what software systems exist and to dive into more detail for the areas that interest them.
However, you may have hundreds of software systems to consider as soon as you have 10, 30 or 50+ teams collaborating on a complex microservice architecture. If every software system has a context diagram, you can imagine the nightmare of trying to manage and keep all those diagrams up to date. More importantly, it can be challenging to organize and present the diagrams in a way that can be easily discovered and navigated by a new team member you’re onboarding.
Defining the boundaries for a software system is a frequent topic of conversation when getting started with the C4 model. It’s a meaningful discussion to have with your team before you jump into creating a bunch of software systems. The advice given on the C4 model website is that a software system should be “owned by” a product or development team. You may not be able to follow this advice depending on how your company and teams are structured, but it works well for most cases.
Let’s discuss how level 0 can help.
🖼️ The system landscape diagram
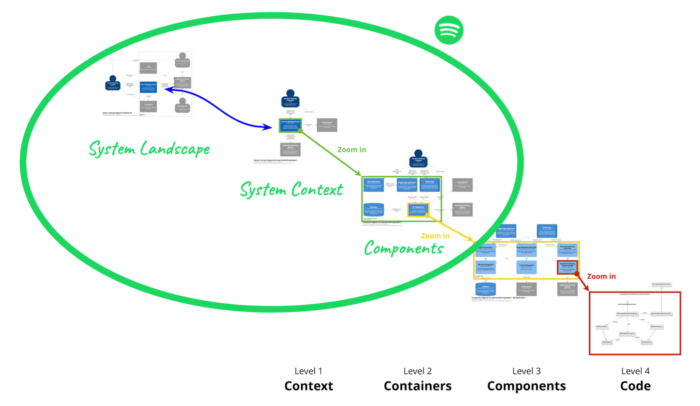
When talking about level 0, people are usually referring to the optional system landscape diagram under the supplementary diagrams section of the C4 model website. This diagram sits “on top” of the context diagram level and is scoped to an “enterprise.” Unlike the system context diagram, which focuses on a single system, the system landscape diagram gives a high-level overview of software systems across the organization.
Spotify engineering recently released a blog post about how they implemented the C4 model and mapped their internal abstractions to it. They use system landscape diagrams to describe a set of related systems, “for example, all systems owned by a squad or all systems in a domain.”

The system landscape diagram provides a much simpler entry point into your (potentially complex) lower-level C4 model diagrams when dealing with large numbers of software systems. People can first learn about the overall system architecture before diving into the context diagrams for software systems that interest them.
🧑💻 Our implementation of level 0
At IcePanel, we’ve been talking with our customers for months about adding a level 0 and learning about what problems it could solve. We landed on a design we think made sense and shipped it as part of our version 42.0 release.
So how did IcePanel’s structure look before the release? Each landscape could have many model objects that represent the abstractions from the C4 model. Each model object could then have many C4 model diagrams underneath it.
Landscape -> Model Object (Abstractions) -> DiagramWe strongly believe that the most powerful part of a modelling tool is the shared understanding and vocabulary provided by a single source of truth. Drawing diagrams from a central set of objects and keeping your diagrams in sync is incredibly valuable, especially when working across many teams. The IcePanel landscape already provides this functionality, and it was essential for us to keep this magic working at level 0.
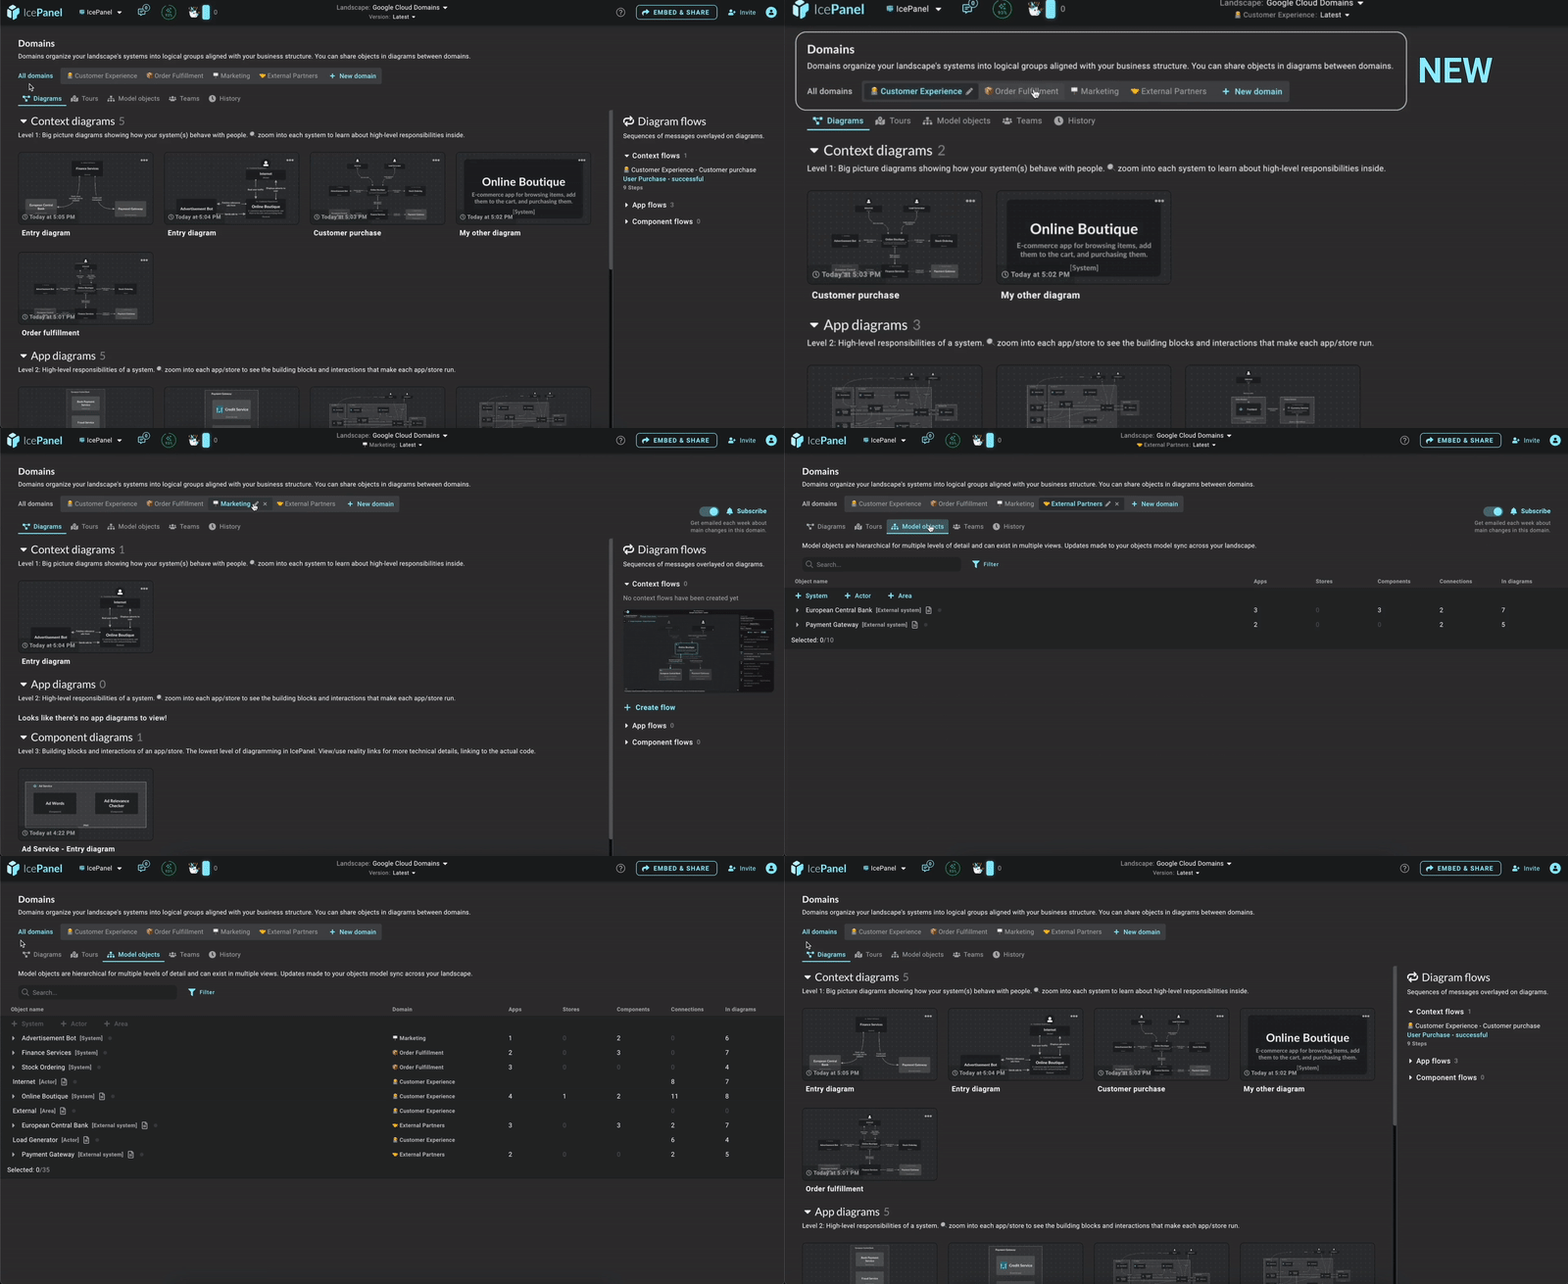
We decided to create a new concept called domains, which optionally sits just below the landscape and contains its model object hierarchy and diagrams. The simple interface acts like a filter, allowing you to view the entire landscape’s model objects and diagrams or narrow the scope to individual domains.
Landscape -> Domain -> Model Object (Abstractions) -> Diagram
Referencing model objects in other domains from inside a diagram was also important as we understand systems are inherently complex and interconnected. We made it super simple to draw these references and seamlessly move objects between domains.

We hope this gives people viewing a landscape for the first time a quick understanding of your high-level organization structure and allows them to dive further into details for domains or software systems that interest them.
You can also check out our docs page about the feature.
We realize something we’re missing is the top-level system landscape diagrams we talked about earlier. Hopefully, the initial implementation of this feature will help our larger teams organize their landscapes without the need to create new diagrams. We’ll continue investigating if and how a system landscape diagram would add value to the tool.
🏁 To wrap up
So we’ve discussed some challenges when implementing the C4 model across larger teams or when describing large complex systems. Even though the C4 model is very simple (and we hope it stays this way), it does contain some ideas for helping with these scaling problems. We believe that tooling in this space needs to come up with creative solutions that enable the C4 model to be used at scale in larger organizations.
Stay chill 🧊
