⚡️ TL;DR
In this guide, we explain how to diagram a microservices architecture using the C4 model in IcePanel. You’ll learn how to create context, container, and component diagrams to represent different levels of detail for an e-commerce system on the Google Cloud Platform.
📖 Overview
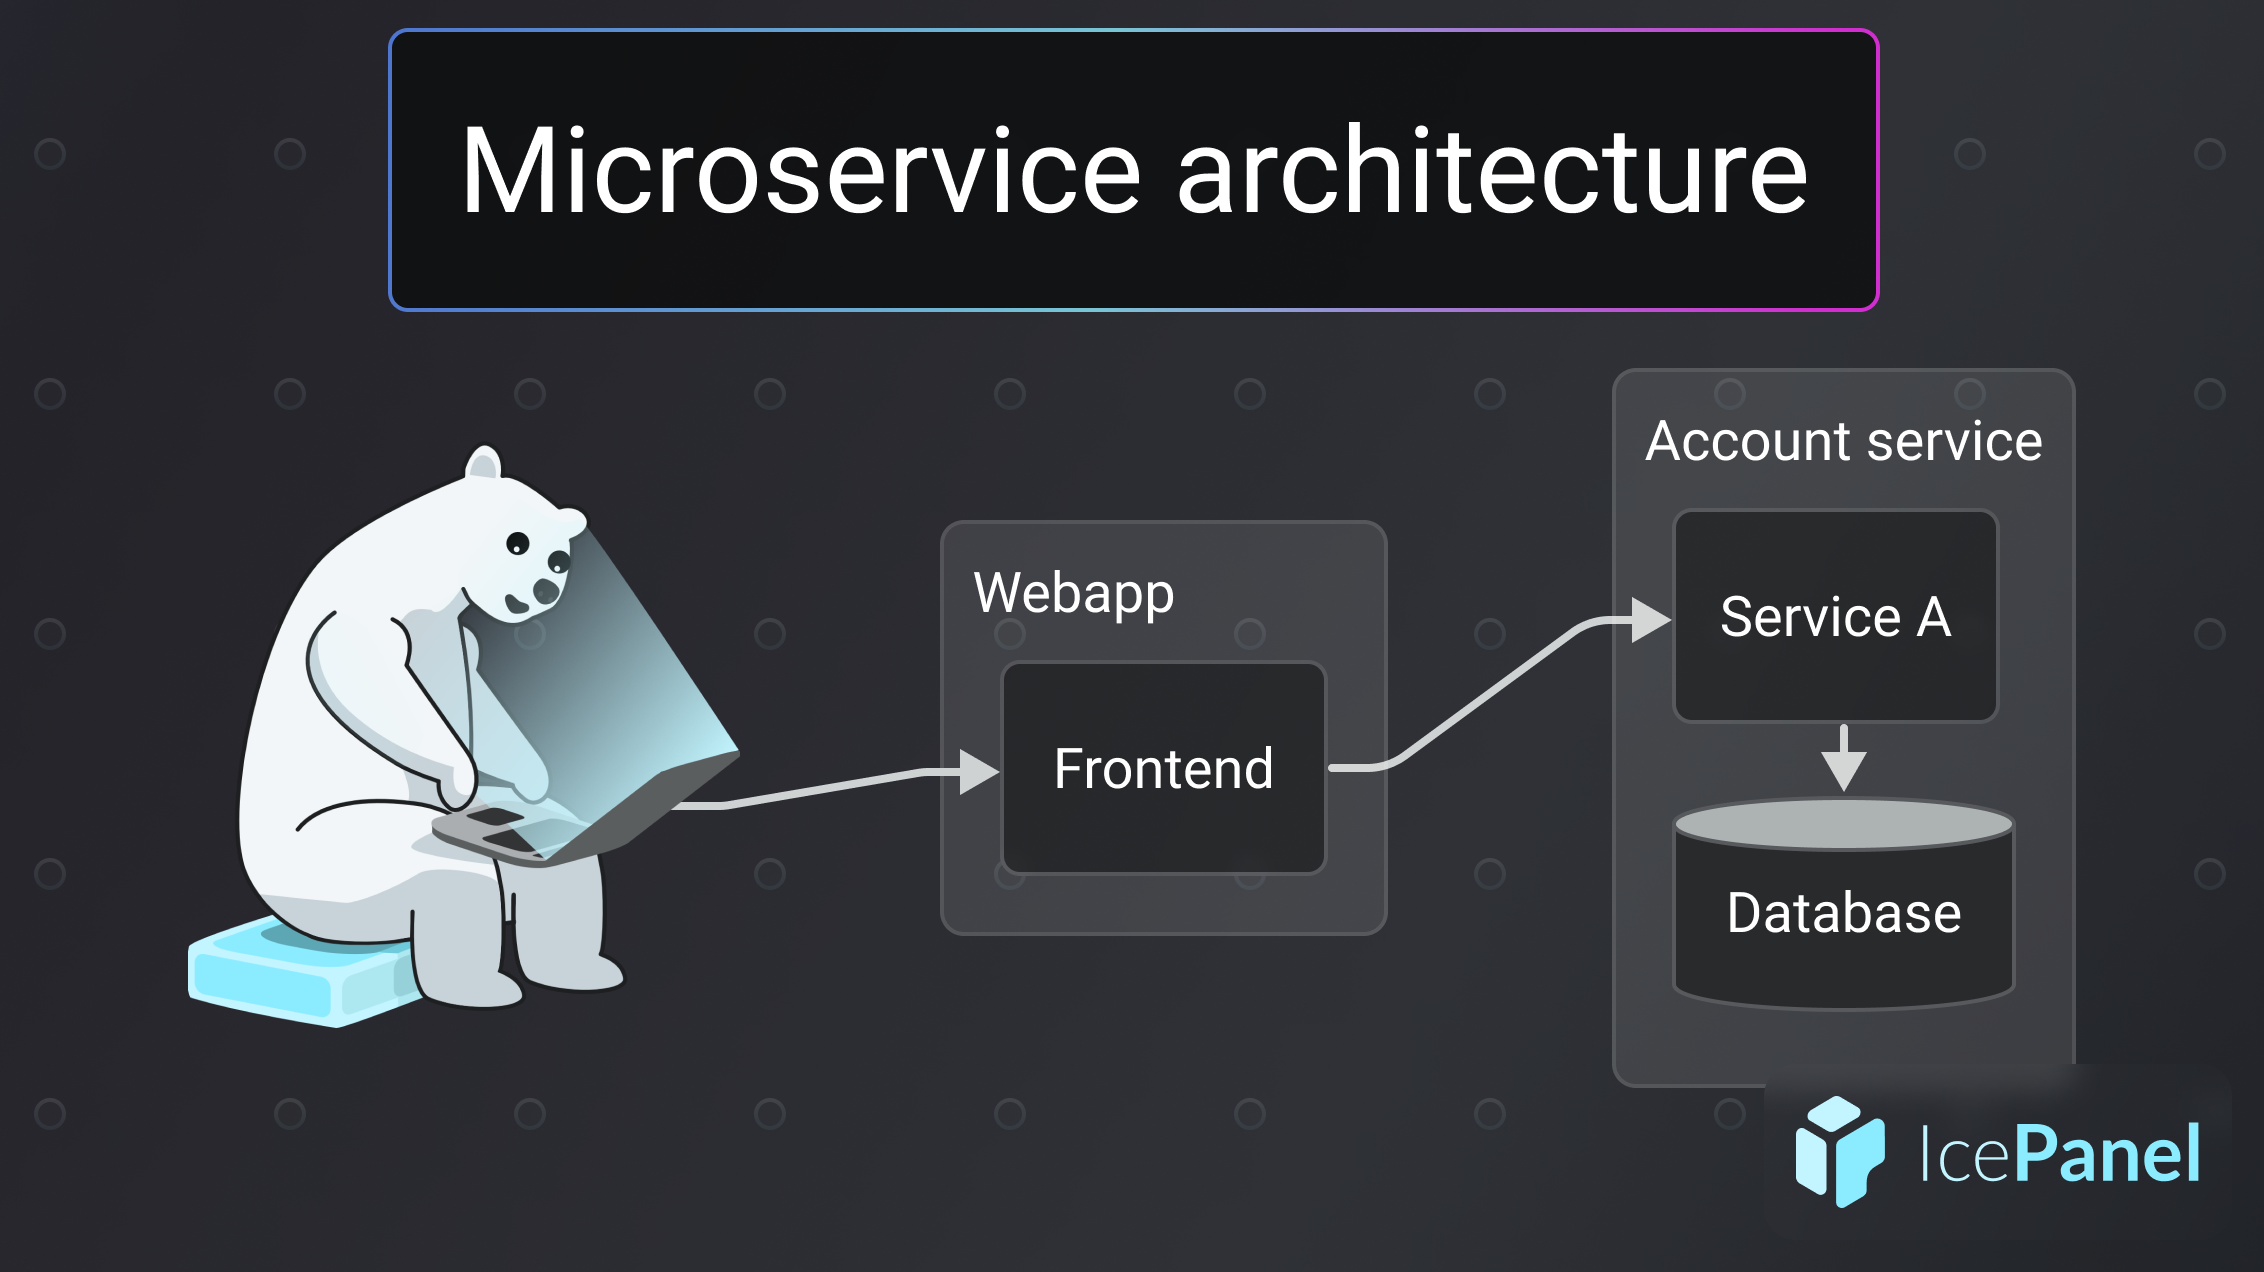
Microservices have become the bedrock of modern application development. In a microservices architecture, loosely coupled services responsible for discrete business capabilities enable teams to develop and deploy systems faster with less risk.
The C4 model is perfect for visualizing microservices with apps and stores abstractions in Level 2. In this guide, we’ll walk you through an example of how to do this in IcePanel and share cool tips to elevate your diagrams. Let’s begin!
🛒 Icy-Bay Commerce
For this example, we’ll model a hypothetical e-commerce system called Icy-Bay. This system allows customers to visit a web app, browse products, checkout, and have their order delivered. This app was built on the Google Cloud Platform and deployed on Google Kubernetes Engine.
1️⃣ Level 1 — Context diagram
This diagram shows the big picture architecture and contains actors and systems.
Actors
- Customers: People who browse and purchase products from Icy-Bay.
Systems
- Icy-Bay: Online store for customers to browse and purchase items from.
- Payment provider: Stripe manages billing, payments, and refunds.
- Central bank: External system to manage exchange rates.
- 3rd party mail client: Future external system to manage email delivery.
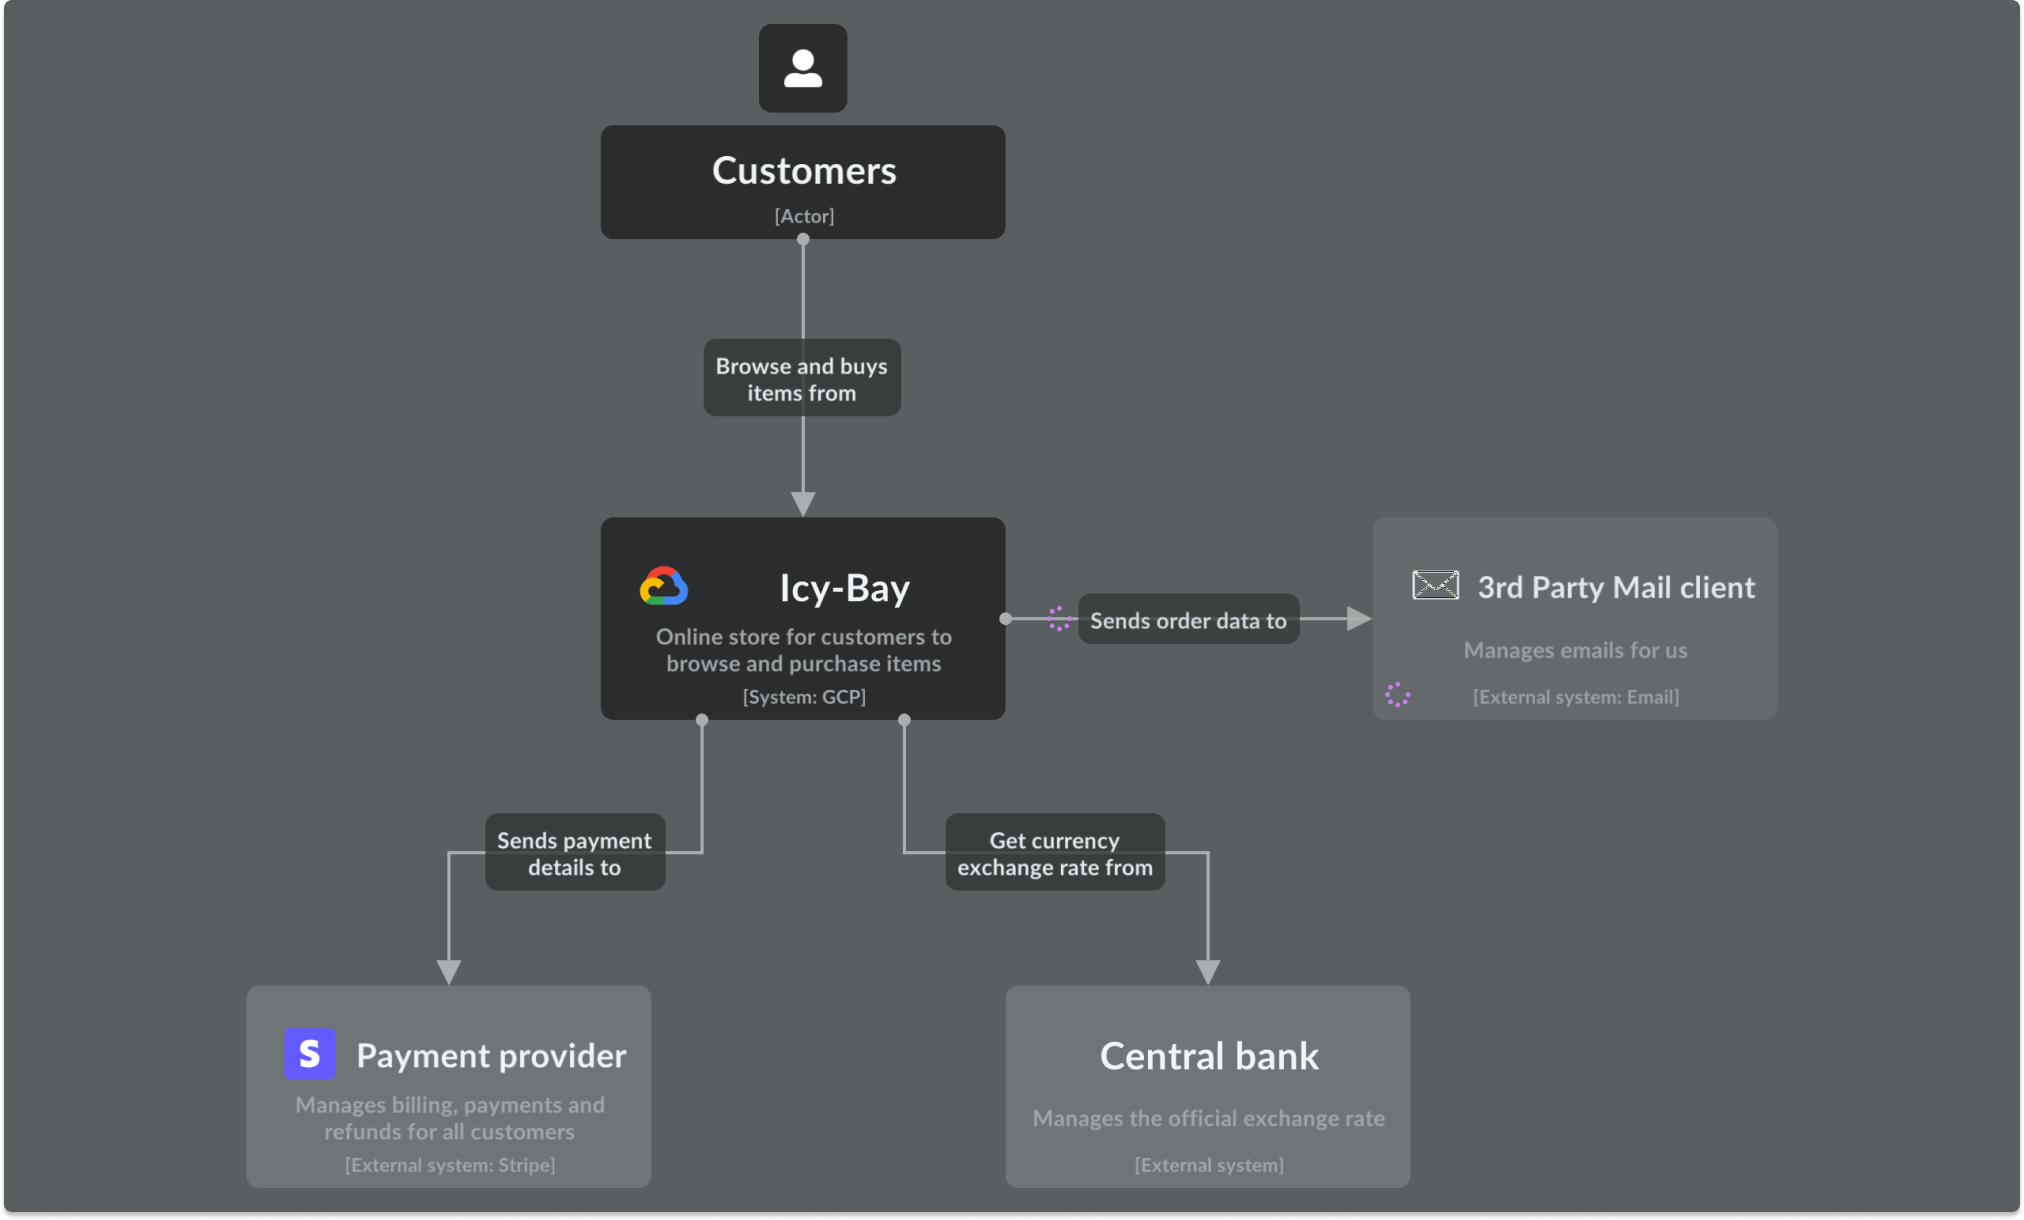
Level 1 context diagram for the Icy-Bay system
2️⃣ Level 2 - Container (app) diagram of Icy-Bay
Zooming into Icy-Bay, we now focus on the system’s microservices. In a Level 2 diagram, we can include apps and stores in addition to Level 1 abstractions. We’ll represent services as apps and databases as stores.
We’ll also include external systems like Stripe and the Central Bank in this diagram to show not only the internal interactions in the Icy-Bay system but also how they behave with things outside of it. We can represent these external systems as system abstractions or expanded systems with apps and stores inside IcePanel.
Apps
- Frontend: Exposes an HTTP server to deliver the website.
- Product catalogue service: Provides a list of products from a JSON file and ability to search or get products.
- Checkout service: Retrieves user cart, prepares the order, orchestrates the payment, shipping and email notification.
- Shipping service: Gives shipping cost estimates based on the shopping cart. Ships items to the given address.
- Cart service: Stores the items in the user’s shopping cart in Redis and retrieves them.
- Payment service: Charges the given credit card info with the amount and returns a transaction ID.
- Currency service: Converts money amount to another currency.
- Recommendation service (future): Recommends other products based on what’s given in the cart.
- Ad service (future): Provides advertisement based on context keys.
- Email service (future): Sends customer emails using templates and customer data.
Stores
- Cart cache: Stores cart data.
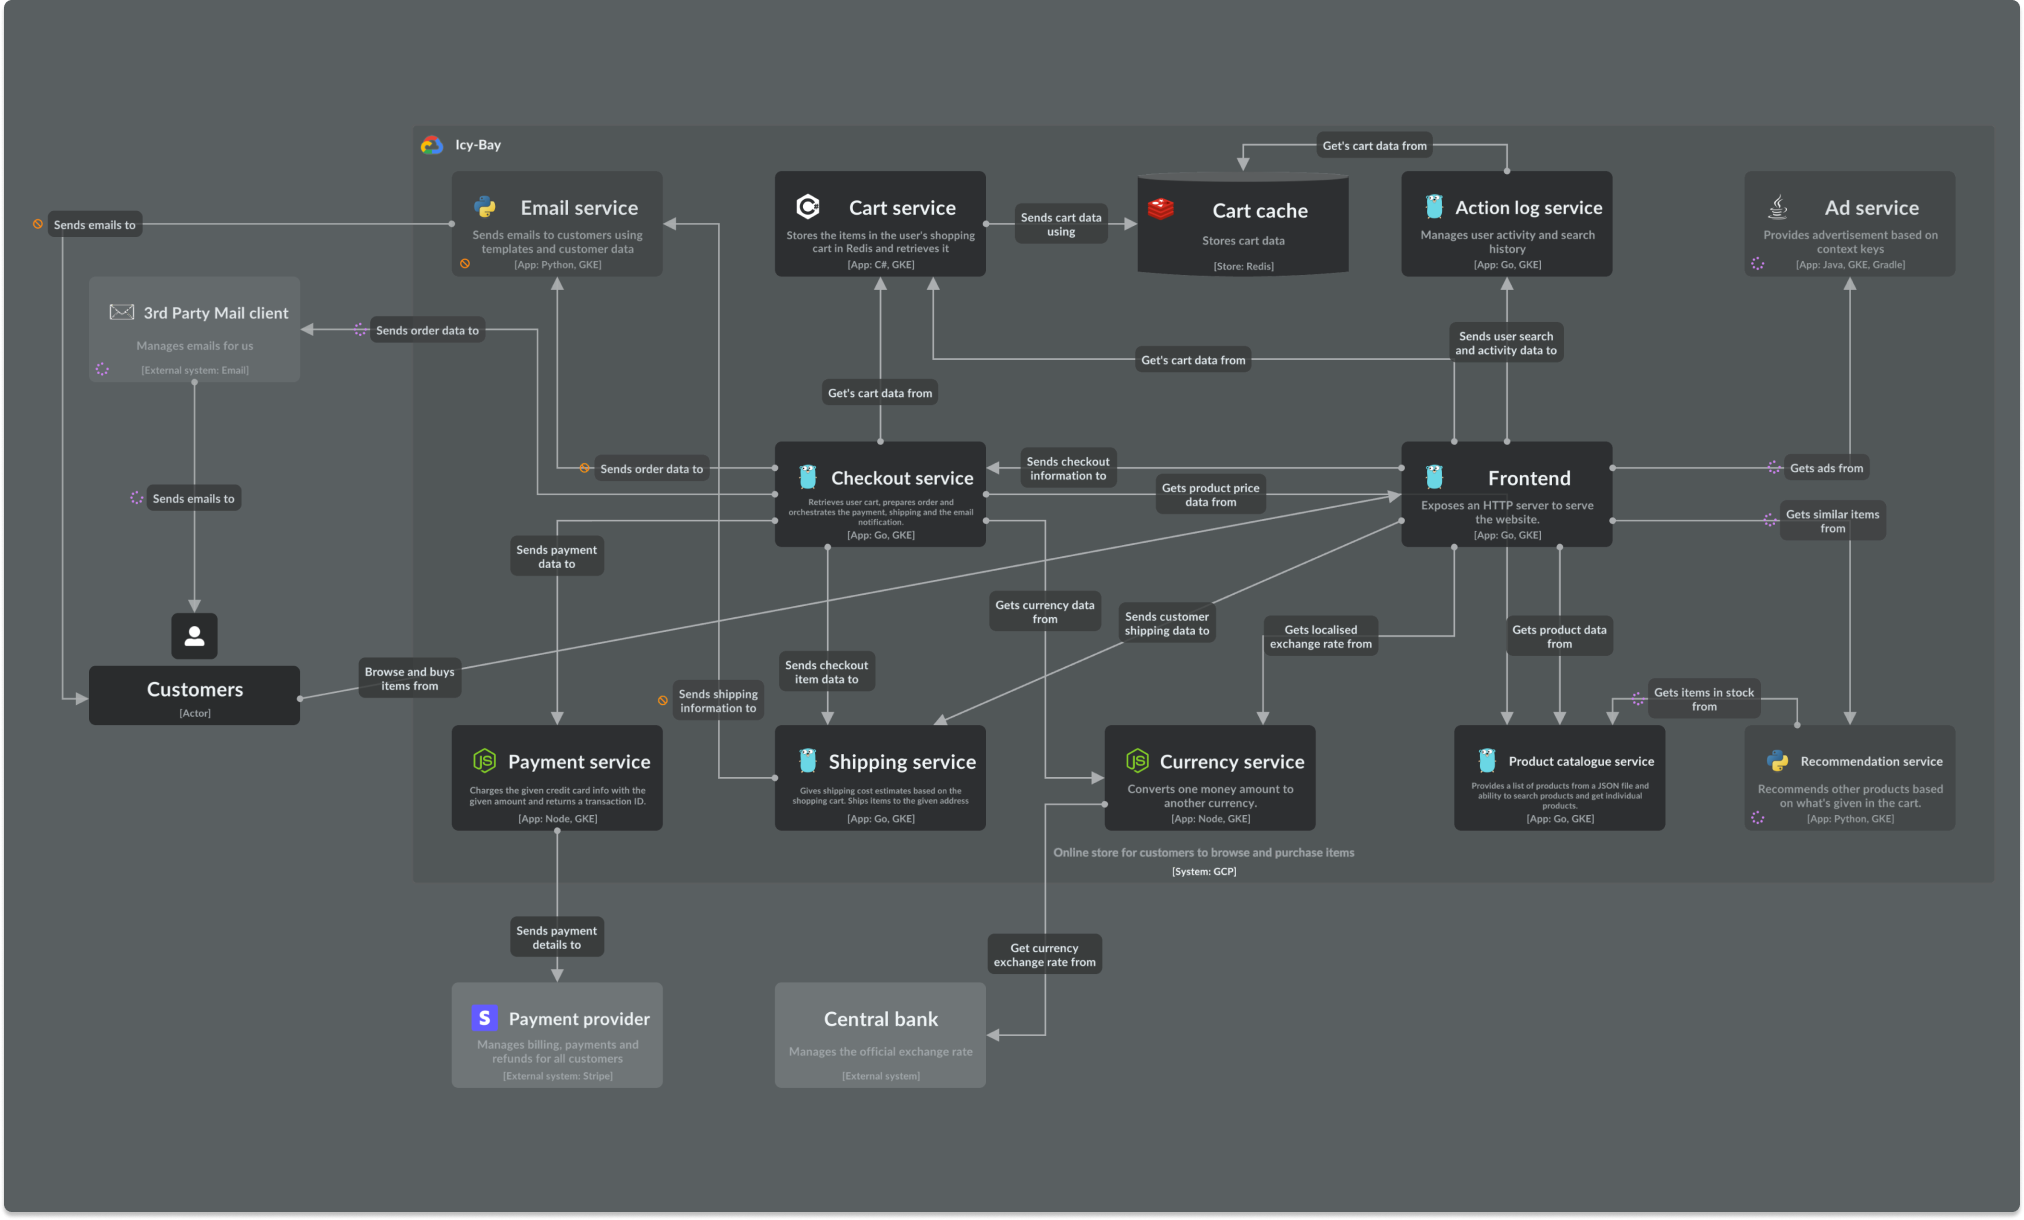
Level 2 diagram of the Icy-Bay system
You might be wondering, shouldn’t each microservice have their own store? That’s correct. We can represent the microservice unit (API, other logic, and database) by creating a Group. A Group is a flexible object-type that allows you overlay additional information around model objects in a diagram.
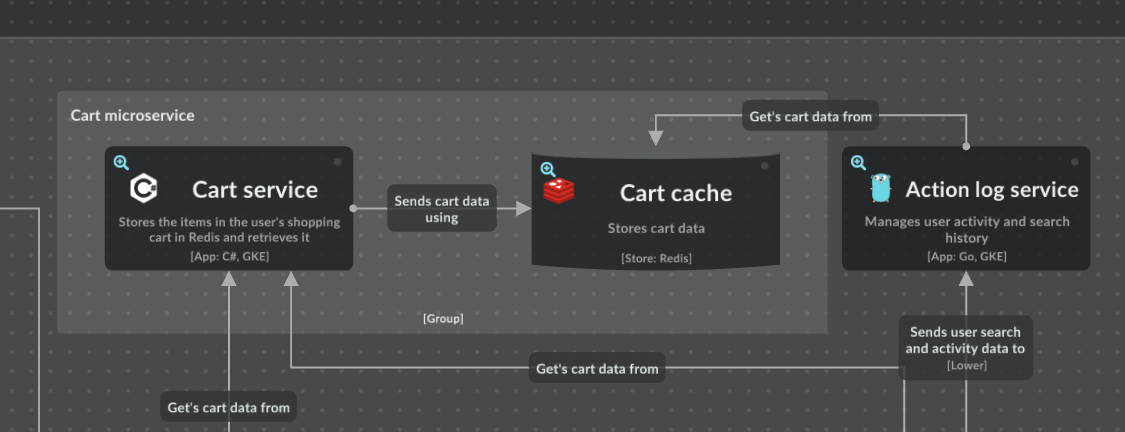
Using a Group to visualize the cart service and cache
In this example, you could argue that having the Action log service retrieve cart data from the Cart cache isn’t the best practice in microservices design. You wouldn’t be wrong. Visualizing this makes it clear that we need to fully decouple microservices to mitigate risk.
3️⃣ Level 3 - Component diagram of Frontend
Zooming in on the Frontend app, we now diagram the logical groupings of code inside the app. If it’s a store, we can highlight relevant information like tables.
Similar to the Level 2 diagram, we can include objects in any level above, such as apps, stores, and systems. Level 2 objects will be nested inside the expanded system to communicate the hierarchy.
Components
- User profile module: Manages user profile information.
- History module: Manages user search history and activity.
- Security module: Manages signing in, changing passwords and external authentication.
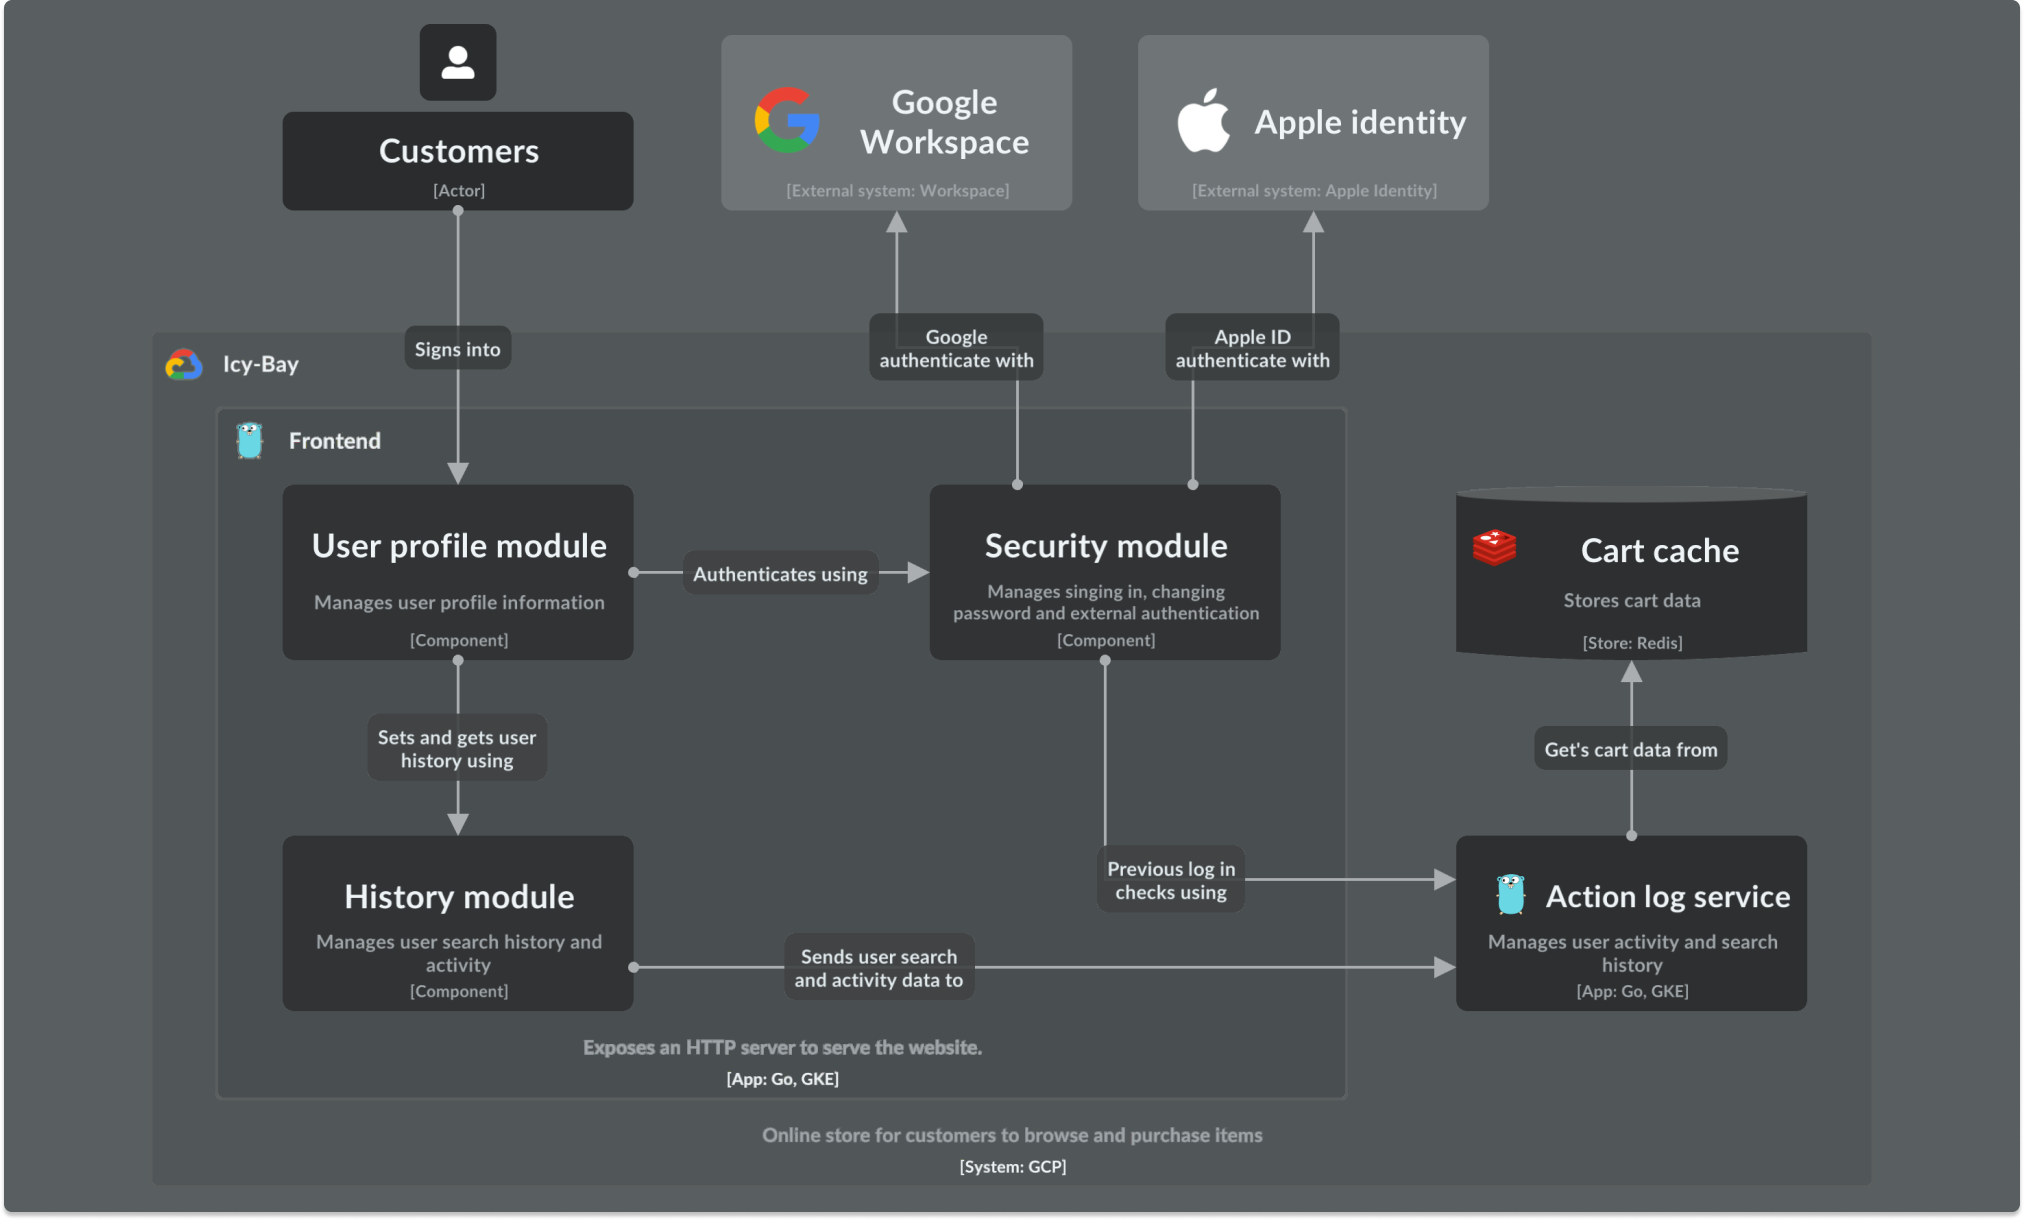
Level 3 diagram of the Frontend app
We can continue from here and create Level 3 diagrams for different apps and stores that are valuable for our team to define. Once you have created many of these diagrams, you can easily navigate up and down the hierarchy without manually organizing them in a folder.
🏁 Final thoughts
In this guide, we walked through diagramming a microservices architecture in IcePanel using the C4 model, focusing on an e-commerce system. We started with a high-level context diagram showing the main actors and systems, then zoomed in to a container diagram showing the individual microservices as apps and their interactions. Finally, we broke down the Frontend app into its component modules.
The C4 model is designed to be flexible enough to visualize different architectural patterns. In our next guide, we’ll cover how to visualize event-based architectures. See you there! 👋
