⚡ TL;DR
- Deployment diagrams show how software is made available to end-users on physical hardware.
- Deployment diagrams mainly consist of nodes (hardware), artifacts (software elements), and relationships (connections between artifacts).
- These diagrams are useful for planning system scaling, migrations, disaster recovery, and evaluating infrastructure costs.
- IcePanel allows you to create deployment diagrams using Groups and Tags to represent nodes with nested objects.
🤔 What is a deployment diagram?
The 4 main diagram types in the C4 model focus on the structure of the architecture, but they don’t explain how your software is deployed on hardware to reach users. A deployment diagram shows how your systems and the objects within them are deployed to the infrastructure in different environments. These diagrams help answer key questions about scalability and cost.
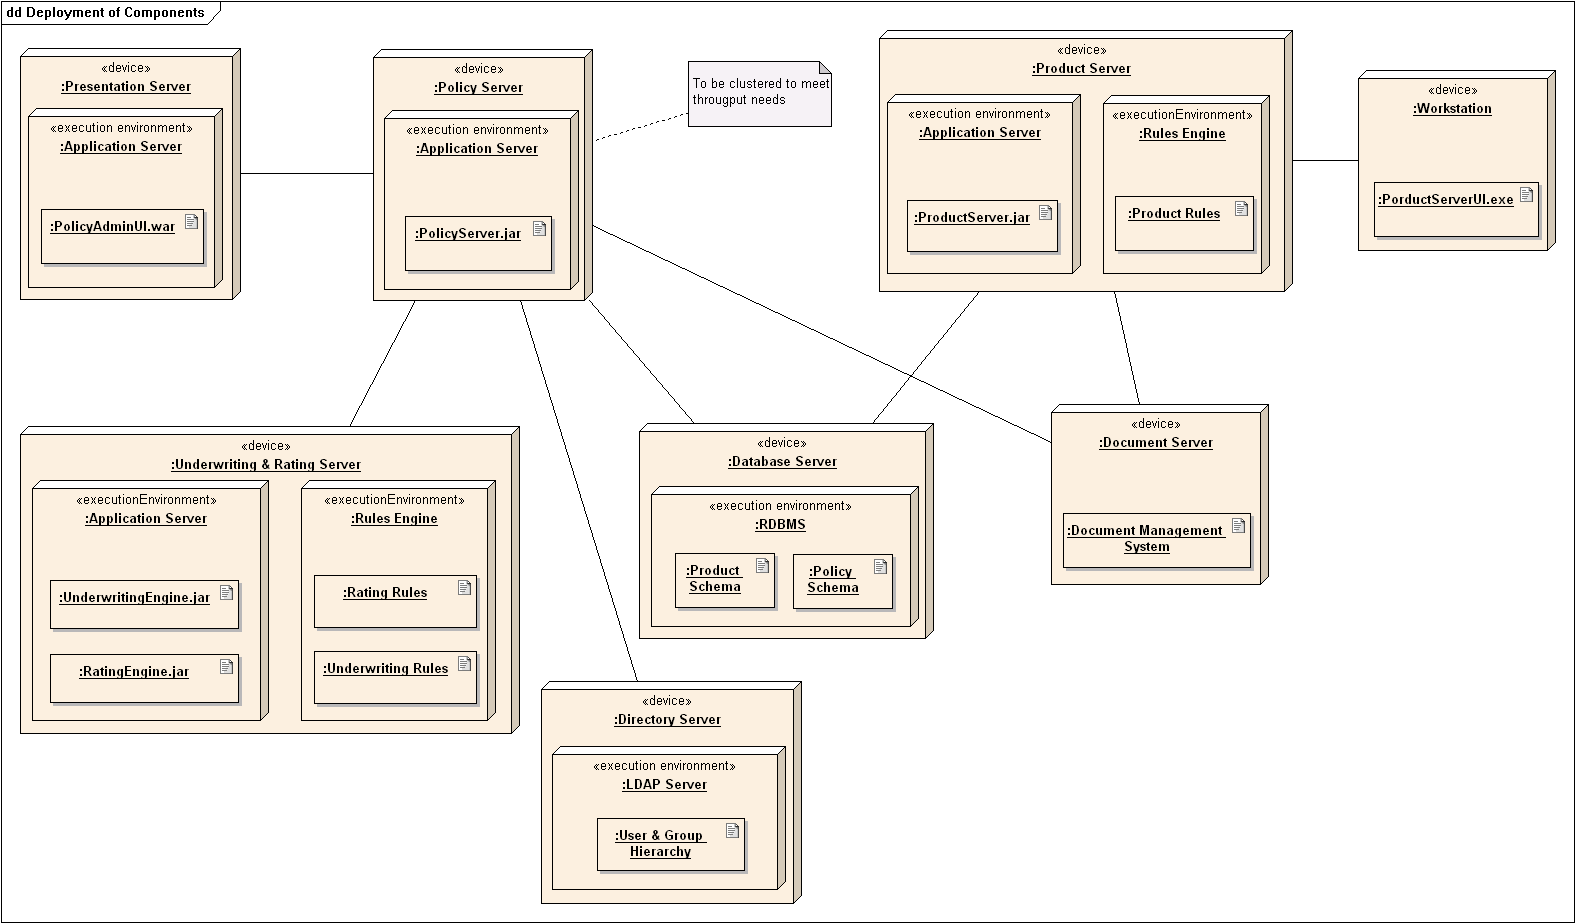
An old-school UML deployment diagram
Deployment diagrams exist as a UML diagram type and can be created in the C4 model. A deployment diagram is made up of several key concepts:
- Nodes: Hardware components where the software is deployed.
- Artifacts: Elements of the software that run on the node (apps, stores, components).
- Relationships: Connections between the different artifacts.
⌚ When should you use a deployment diagram?
A deployment diagram is useful when you want to:
- Assess the scalability of your systems or plan how you’re going to scale your system
- Plan migrations between different cloud providers or from on-prem to cloud
- Evaluate your disaster recovery plan (tip: Use Flows to show a backup process)
- Get an overview of infrastructure costs across different providers
🧊 How do you create a deployment diagram in IcePanel?
You’ll usually create a deployment diagram at Level 2 in IcePanel, but you can also create one at Level 1 or 3, depending on what you want to communicate (e.g., “Where are my systems deployed?”, “Where are my components deployed?”).
IcePanel allows you to show deployment information using Groups and Tags. Groups let you overlay additional information around model objects in a diagram. You can assign as many model objects (except Groups, coming soon!) as possible to one or more Groups. Tags are customizable properties that you add to model objects. You can add as many tags to an object to display secondary deployment information that isn’t as critical to show in the diagram immediately.
To create a deployment diagram in IcePanel:
- Create a group representing the node (ex: ‘Google Cloud VPC US-West 1’).
- Assign objects (apps, stores, and/or components) to the Group using the right-hand panel.
- Create as many other groups for sub-nodes as you like and assign objects to each group. When multiple Groups are added to a diagram, they’re automatically resized and nested depending on the order in which they were added.
- If you prefer a cleaner diagram, we recommend sticking to 1 Group and using tags instead to represent additional attributes.
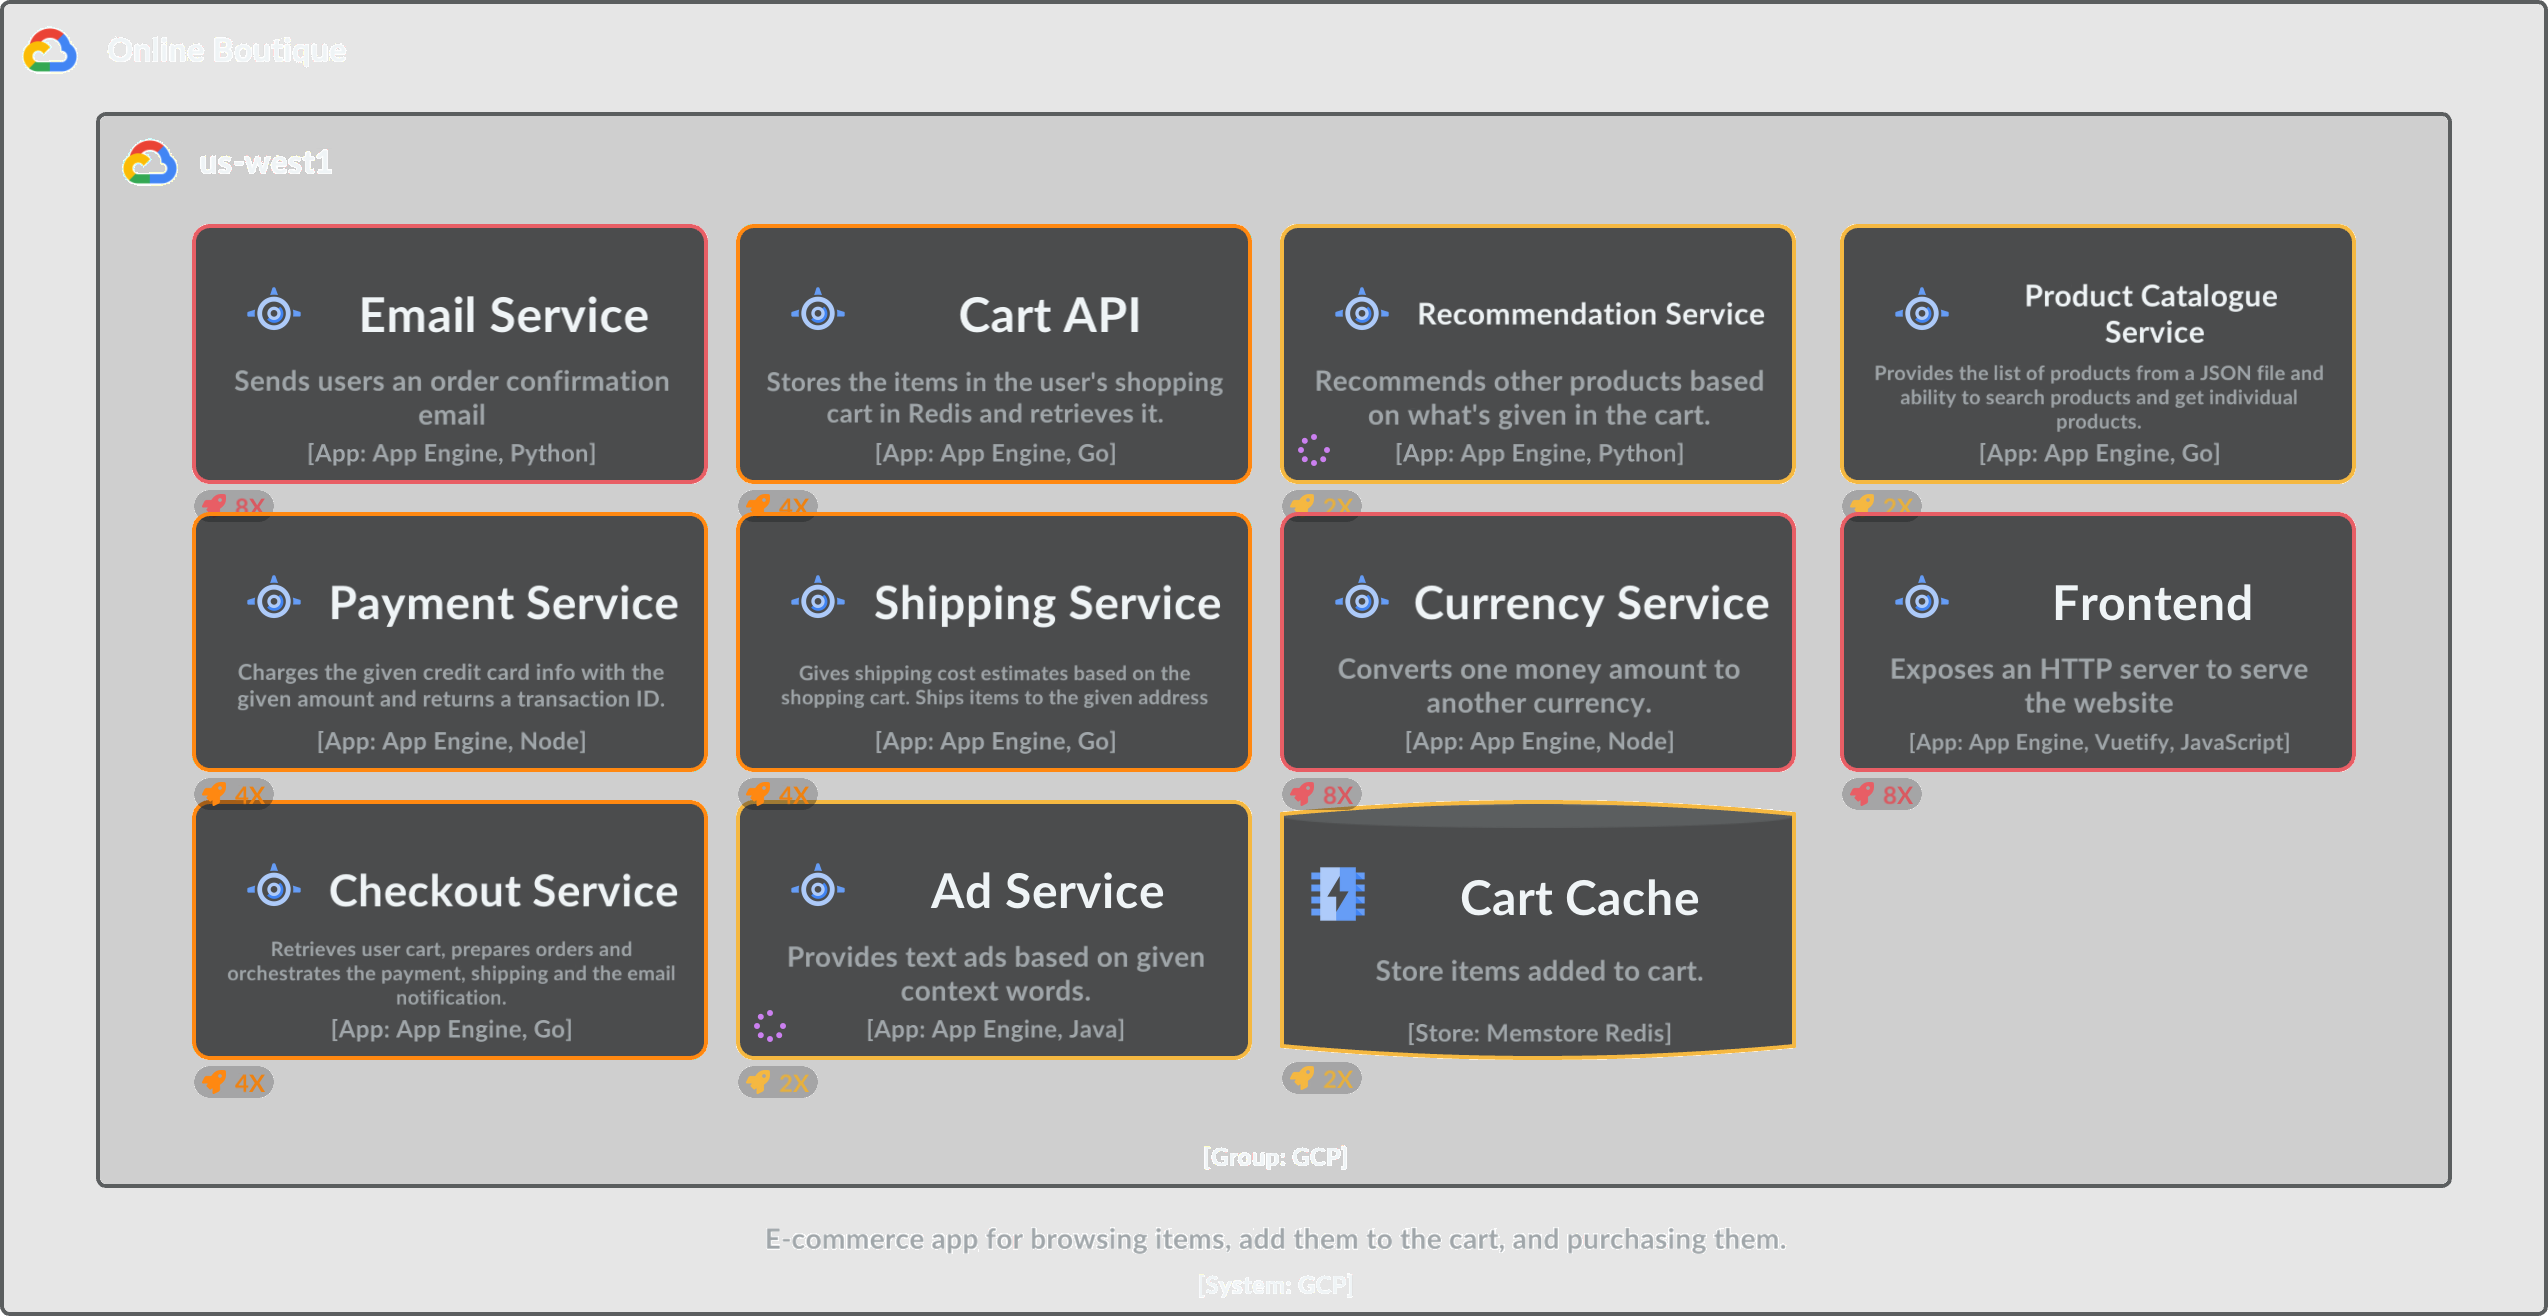
Deployment diagram with region Group and pinned deployment tags
In this example, we added apps and stores to a region Group (’us-west1’). We then created a tag group and tagged objects with their respective deployment counts (1x, 2x, 4x, or 8x). Lastly, we opened the tag bar and pinned the specific tags so they appear in the diagram.
Alternatively, we can create separate Groups for deployment counts if we want clearer separation in the diagram (but more Group nesting and less colour). Choose which one you prefer and keep it consistent across your deployment diagrams.
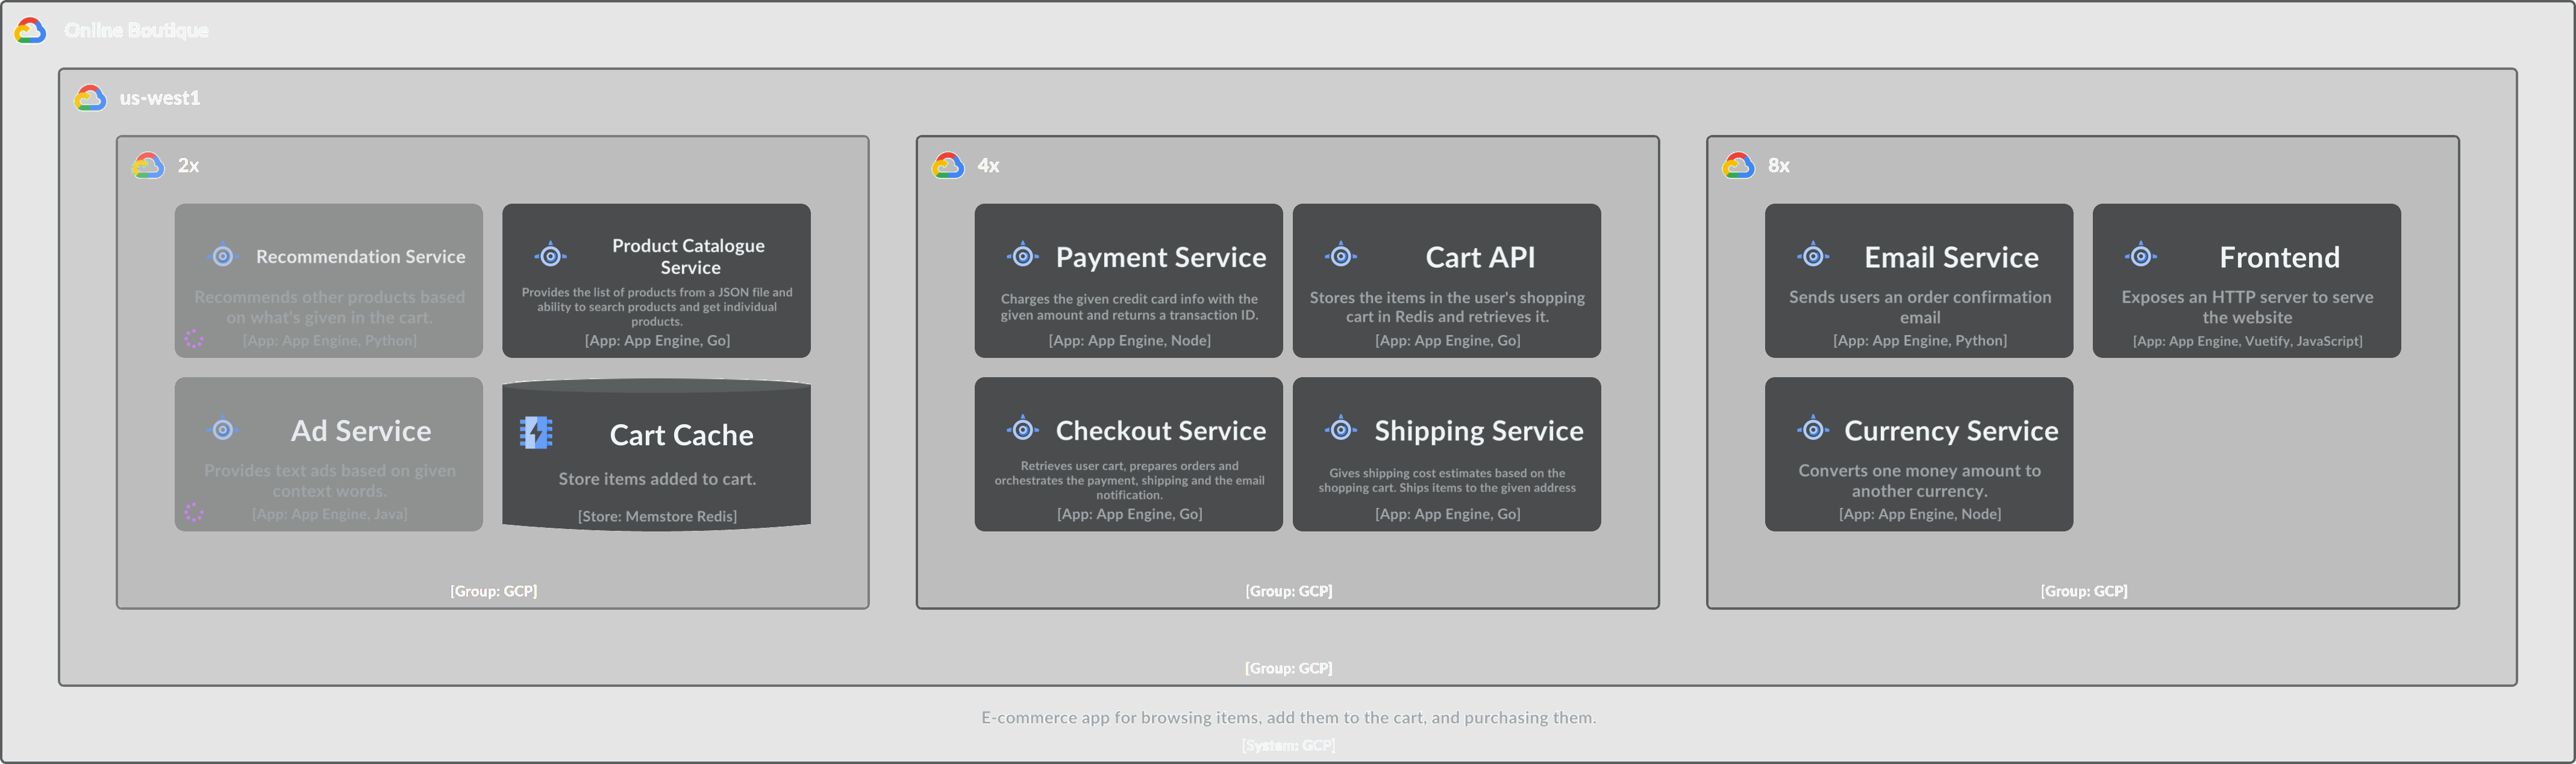
Deployment diagram with region and deployment count Groups
➡️ Next up
In addition to explaining how your system is deployed to your end users, you might want to show something more dynamic, like how your system supports a specific user journey. This is where dynamic diagrams (Flows in IcePanel) can be useful. Let’s continue!
